DEPT
#Chemistry
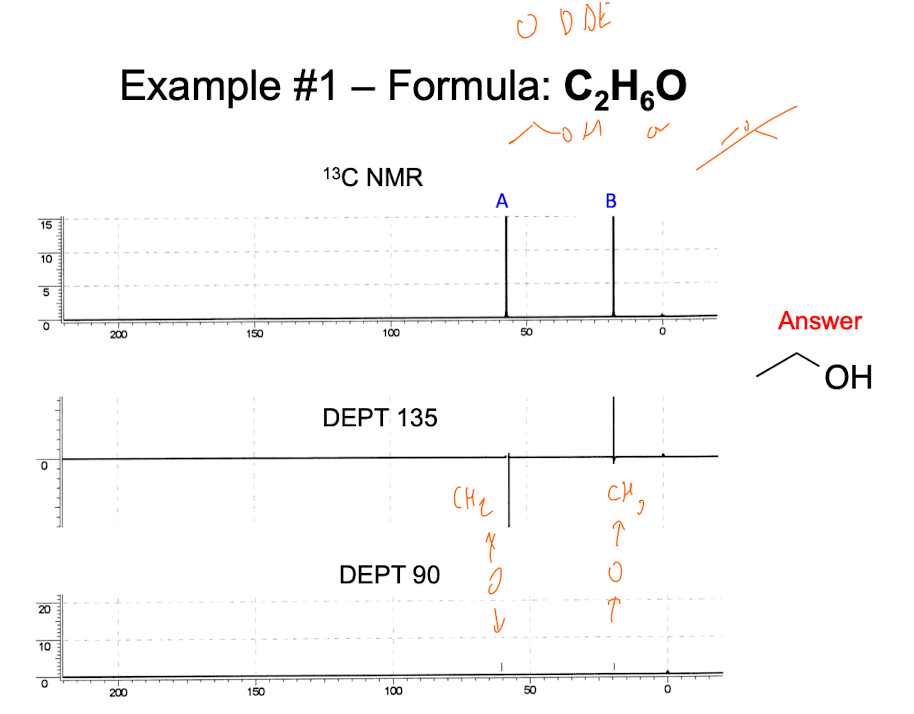
This table tells how many hydrogens are attached to a carbon based on the peak direction for DEPT x graphs
| # Hydrogens | 0 | 1 | 2 | 3 |
|---|---|---|---|---|
| DEPT 45 | None | UP | UP | UP |
| DEPT 90 | None | UP | 0 | 0 |
| DEPT 135 | None | UP | DOWN | UP |
Example
#Chemistry
This table tells how many hydrogens are attached to a carbon based on the peak direction for DEPT x graphs
| # Hydrogens | 0 | 1 | 2 | 3 |
|---|---|---|---|---|
| DEPT 45 | None | UP | UP | UP |
| DEPT 90 | None | UP | 0 | 0 |
| DEPT 135 | None | UP | DOWN | UP |